
⛳ Bourke, New South Wales is situated in or near the subtropical thorn woodland biome.
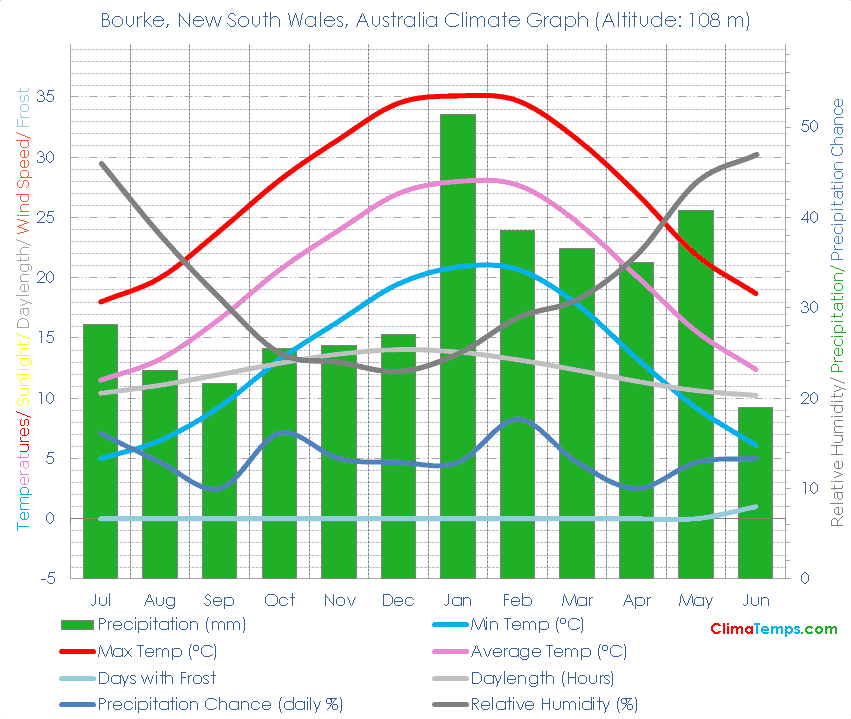
🌡️ The annual mean temperature is 20.1 degrees Celsius (68.2 degrees Fahrenheit). See the temperatures page for a monthly breakdown and the fixed scale graph.
🐬 Average monthly temperatures vary by 16.5 °C (29.7°F). This indicates that the continentality type is oceanic, subtype truly oceanic.
☔ Total annual precipitation averages 372.5 mm (14.7 inches) which is equivalent to 372.5 Litres/m² (9.14 Gallons/ft²).
Simply paste the following HTML code into your webpage. Please include a link back to this website. There is one in the following code already. Edit the width attribute to change the size of the graph if needed:
✨ The longest day of the year is 13:56 long on the 21 of December and the shortest day is 10:03 long on the 22 of June.
🐇Were you to burrow down through the centre of the Earth from Bourke, New South Wales you would pop up nearest to the climate station at Horta, Faial, Azores where you would find a Humid subtropical climate.
🌍Bourke, New South Wales, Australia is at 30°2'S, 145°57'E, 108 m (354 ft). Check the location on the map.
| Climate Variable | Jul | Aug | Sep | Oct | Nov | Dec | Jan | Feb | Mar | Apr | May | Jun | Annual | ||
|---|---|---|---|---|---|---|---|---|---|---|---|---|---|---|---|
| Average Max Temperature °C ( °F) | 18 (64) | 20 (68) | 24 (75) | 28 (83) | 32 (89) | 35 (94) | 35 (95) | 35 (94) | 32 (89) | 27 (81) | 22 (71) | 19 (66) | 27 (81) | ||
| Average Temperature °C ( °F) | 12 (53) | 13 (56) | 17 (62) | 21 (69) | 24 (75) | 27 (81) | 28 (82) | 28 (82) | 25 (76) | 20 (68) | 16 (60) | 12 (54) | 20 (68) | ||
| Average Min Temperature °C ( °F) | 5 (41) | 7 (44) | 9 (49) | 13 (56) | 16 (62) | 20 (67) | 21 (70) | 21 (69) | 18 (64) | 13 (56) | 9 (49) | 6 (43) | 13 (56) | ||
| Average Precipitation mm (in) | 28 (1) | 23 (1) | 22 (1) | 26 (1) | 26 (1) | 27 (1) | 51 (2) | 39 (2) | 37 (1) | 35 (1) | 41 (2) | 19 (1) | 373 (15) | ||
| Number of Wet Days (probability of rain on a day %) | 5 (16) | 4 (13) | 3 (10) | 5 (16) | 4 (13) | 4 (13) | 4 (13) | 5 (18) | 4 (13) | 3 (10) | 4 (13) | 4 (13) | 49 (13) | ||
| Average Daylight Hours/ Day | 10h 24' | 11h 04' | 11h 58' | 12h 53' | 13h 40' | 14h 02' | 13h 50' | 13h 12' | 12h 20' | 11h 24' | 10h 37' | 10h 14' | 12h 00' | ||
| Sun altitude at solar noon on the 21st day (°). | 39.5 | 47.8 | 59.2 | 70.3 | 79.3 | 83.4 | 79.6 | 70.3 | 59.8 | 48.2 | 39.8 | 36.5 | 59.5 |
Please take a moment to share a climate graph or simply the address:
Thank You, so much! ❤️